LA INFRAESTRUCTURA DE DATOS ESPACIALES (IDE)
Uno de los objetivos que nos marcamos cuando comenzamos nuestra investigación fue la construcción de la IDE (Infraestructura de Datos Espaciales) del castro de San Chuis, con la intención de recoger y estructurar toda la información existente. Este estudio representa una «nueva intervención» sobre el yacimiento, donde la información proporcionada por las excavaciones llevadas a cabo hasta 1986 se presenta bajo otro enfoque, recuperando las evidencias ya publicadas con anterioridad. La infraestructura de datos no modifica la información procedente de la excavación, sino que establece las relaciones entre los datos a través de un protocolo estándar.
Con este fin, hemos acometido un proceso general de digitalización y sistematización de toda la documentación e información arqueológica que manejábamos con el objetivo de construir dicha IDE. Esta información, que se encontraba en su mayor parte en papel, tenía bastantes años y estaba comenzando a sufrir el deterioro lógico del paso del tiempo. Con la construcción de la IDE no solo recogeríamos esta información en un formato duradero, sino que procederíamos a su estructuración y sistematización.
Igualmente, hemos desarrollado una Base de Datos General complementada con una completa planimetría descriptiva. Al mismo tiempo, -y es una de las cuestiones más interesantes en todo este proceso- hemos procedido a la reintegración del registro arqueológico en su contexto espacial original, dotándolo de coordenadas reales dentro de un sistema de información georreferenciado, que nos ha permitido realizar análisis tanto macro como micro espaciales.
Hemos, por lo tanto, transformado una información presentada en un formato obsoleto y pesado en otra ágil, susceptible de ser tratada y analizada de acuerdo a parámetros más actuales, aportando además otra nueva de la que carecíamos. Este procedimiento es extrapolable a otros yacimientos antiguos y su aplicación facilitaría la conservación de la información, su investigación y su divulgación.
IDE Y ARQUEOLOGÍA: UNA NECESIDAD
Hay que tener en cuenta que el patrimonio arqueológico posee una serie de características intrínsecas que lo hacen idóneo para su integración en sistemas de información de este tipo: la materialidad y la espacialidad. El patrimonio arqueológico se compone de toda una serie de entidades materiales (artefactos, estructuras, suelos, etc.) que son producto directo o indirecto de la actividad humana y, que además, han sufrido, tras su uso histórico, una serie de procesos de deposición y alteración que han modificado su propia materialidad. Las entidades arqueológicas tienen por lo tanto una materialidad compleja que es susceptible de ser analizada de forma sistemática por la Arqueología para interpretar la naturaleza de dichos procesos y el contexto sociocultural que probablemente los generó. La descripción analítica de las entidades arqueológicas implica, por lo tanto, el manejo de un modelo de datos que estructure y normalice, en la medida de lo posible, la información que podamos extraer de ellas (Fraguas et al. 2008).
Por otra parte, las entidades arqueológicas tienen una naturaleza espacial que les viene dada por la posición, forma y dimensiones del contexto de hallazgo. Ésta es susceptible de ser descrita mediante un modelo de datos espaciales.
Al mismo tiempo, es muy importante destacar que el diseño de un registro adecuado de la información arqueológica es doblemente necesario debido a que su propio proceso de obtención conlleva con frecuencia su destrucción, particularmente en la excavación.
La incorporación sistematizada de información debería ser, por lo tanto, un objetivo prioritario, merecedor de un importante esfuerzo investigador. Y esto es así no solo para yacimientos cuya excavación se inicia o que están en pleno proceso de excavación, sino para los que ya lo han sido con anterioridad y cuya información se encuentra en formatos perecederos y obsoletos. Creemos que todo yacimiento arqueológico es susceptible de ser revisado y que cada documento e información conseguidos deberían poder integrarse en un formato legible y con unos criterios concertados, así la información sería accesible y permitiría una validación continua (Rey Castiñeira et al. 2011). Este es nuestro caso con el castro de San Chuis.
La digitalización de la información procedente de una intervención arqueológica supone su integración dentro de un sistema previamente elaborado, orientado al uso de grandes cantidades de datos que posibiliten la adquisición de un mejor conocimiento de los fenómenos históricos objeto de estudio. La creación de los sistemas de información facilita la introducción de datos, pero sobre todo, organiza la forma en que se hace, estableciendo normas en su elaboración que permiten unificar criterios y fijando un control sobre la calidad de la información.
Debido a esta naturaleza de los datos arqueológicos, la información arqueológica se puede definir desde el punto de vista del diseño de sistema informáticos como semi-estructurada. Es decir, tenemos un tipo de información heterogénea a múltiples niveles: en el nivel o grado de estructuración, en los modelos y tipos de datos que manejamos, en la representación de dicha información. Por ejemplo, nos encontramos con una ingente cantidad de documentación en papel. Este tipo de información, legible para los humanos pero no para las máquinas, está contenida en un soporte absolutamente perecedero y debe ser convertida a un formato legible por las máquinas. Una parte se podrá estructurar por medio de una base de datos. Este es el caso por ejemplo del registro, de las diferentes unidades estratigráficas, etc. Otra parte de la información será organizada a partir de un Sistema de Información Geográfica (toda la referente a posicionamiento y localización). Pero además, posteriormente hay que establecer relaciones entre cada uno de los contextos a fin de darle una mayor utilidad descriptiva a toda esta información: hay que establecer relaciones entre unidades estratigráficas y material localizado en ellas. Es por esto que este material debe de estar georreferenciado e integrado en un SIG, que a su vez está contenido en una base de datos relacional, donde es descrito, etc. Esto implica que vamos a necesitar diferentes medios para conseguir estructurar toda nuestra información, y en este caso los medios vienen a ser aplicaciones informáticas.
LA IDE DE SAN CHUIS
Para desarrollar la IDE hemos partido de dos tipos de material: el generado en excavaciones e investigación, y el álbum fotográfico. El primero se compone de los diarios de excavación, el corpus de planos que se elaboró en su momento y el registro original, todo en formato papel. El segundo tipo se componía del archivo personal del profesor Jordá Cerdá, y del posterior elaborado por nosotros mismos.
La primera tarea que emprendimos fue la actualización del plano ya existente y realizado en formato CAD,
integrándolo en un SIG), operación indispensable para los procedimientos posteriores. Situamos por lo tanto el plano en sus coordenadas UTM, siguiendo el Datum Geodésico ETRS 89, vigente en España actualmente. Poseíamos unas coordenadas tomadas con anterioridad pero que seguían el sistema ED 50, por lo que volvimos a tomar la Información del Visor SIGPAC (2016) del Fondo Español de Garantía Agraria (FEGA) del Ministerio de Agricultura, Alimentación y Medio Ambiente. Así mismo, procedimos a la elaboración de otros nuevos planos y de toda una planimetría descriptiva de la estratigrafía del castro (formato CAD).
Al mismo tiempo iniciamos el desarrollo de una base de datos general en la que incluimos tablas para catalogar tanto el registro arqueológico como las unidades estratigráficas (UE) y las unidades estratigráficas murarias (UEM). Tanto para las UE y UEM como para el registro propusimos campos convenientemente descriptivos de su naturaleza, pero para este último además nos planteamos la posibilidad de proporcionar coordenadas UTM a cada elemento del mismo, es decir, dado que ya teníamos todo el sistema debidamente georreferenciado, ¿por qué no intentar reintegrar todo el registro en su contexto espacial de nuevo y reincorporarlo al sistema? Esto nos permitiría levantar planos de distribución de materiales tanto por campañas, como por tipos, proceder a la ejecución de análisis tanto macro como micro espacial, etc.
Reintegración del registro arqueológico
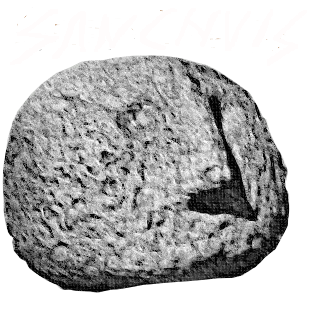
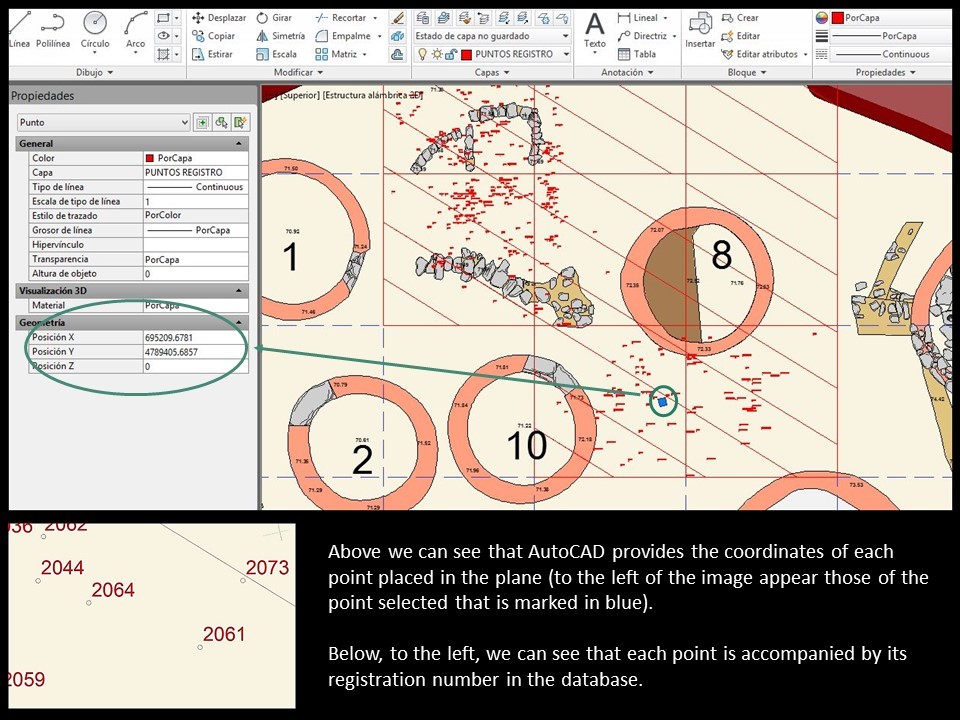
Un plano que está georreferenciado es capaz de proporcionar las coordenadas UTM de cualquier punto situado en él. Por lo tanto, al integrar nuestro plano en un SIG no solo dotábamos de coordenadas todas las estructuras que aparecían en él, sino que, además, este plano estaría en condiciones de proporcionar las coordenadas de cualquier punto que incluyéramos en él. Con este pensamiento nos dispusimos a situar los puntos representativos de los elementos del registro en el plano (Figura1).
Para realizar esta tarea partimos de dos tipos de información distinta: por una parte planos milimetrados
de las cuadrículas excavadas con los elementos del registro representados en ellos mediante puntos, y por
otra parte las medidas de referencia X e Y de cada elemento encontrado durante la excavación, que se
comenzaron a tomar en las campañas del 1983 y del 1985. De acuerdo con esto, proyectamos dos formas de insertar los puntos en el plano. Si partíamos de los planos antiguos, el escaneado y posterior inserción de dichos planos en el general de cada campaña. Si partíamos de las medidas X e Y, simplemente medimos sobre el plano para situarlos siguiendo la cuadrícula de referencia que se había realizado ya en 1980 (Jordá & Molina, 2015).
Por lo tanto, procedimos al escaneado de todos los planos, creando una base documental de 112 planos. De estos, seleccionamos los adecuados para nuestro propósito, es decir, los que representaban las cuadrículas de 4 m x 4 m con las estructuras dibujadas y/o los puntos de hallazgo de los diferentes materiales señalizados. Insertamos estos planos en el general de la campaña correspondiente mediante la aplicación Raster Design de Autodesk, que procesa las imágenes permitiendo trabajar con ellas, e implantarlas exactamente en el lugar y con la escala correcta.
Base de datos
La base de datos está compuesta de tres tablas: la tabla del registro arqueológico, la de las UE y la de las UEM.
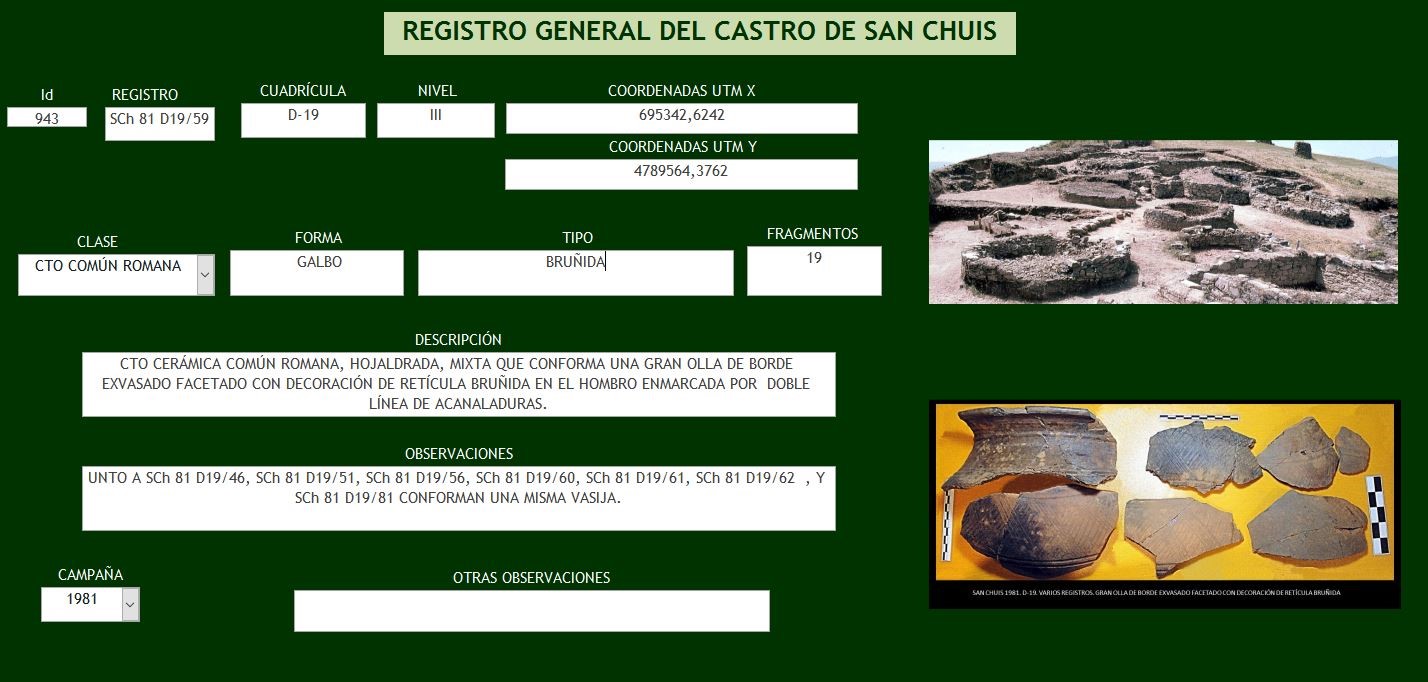
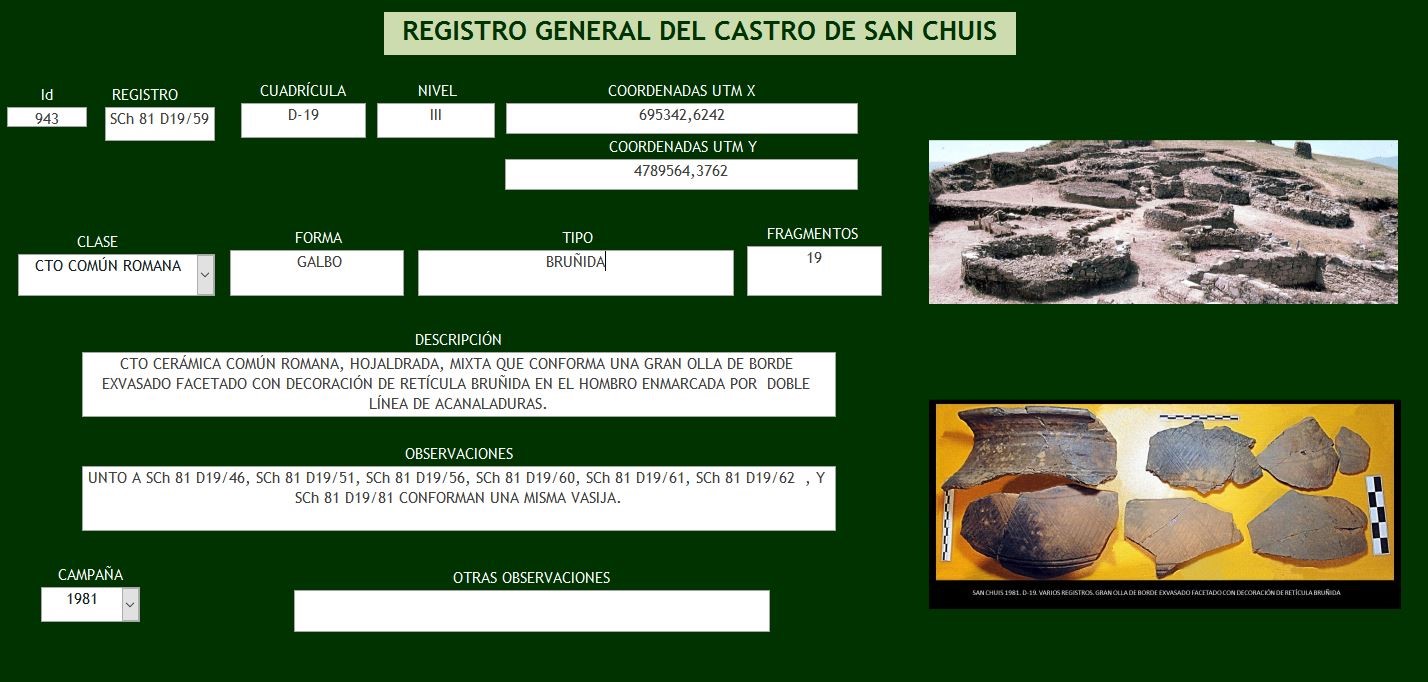
En cuanto a la tabla del registro está formada por 20 campos que intenta describir exhaustivamente cada elemento que lo compone. En total hemos incluido 3326 registros. El número de registros no coincide con el número de fragmentos, que es mucho mayor, ya que a algunos registros le corresponden varios fragmentos.
A la hora de introducir los datos en la tabla hemos seguido diferentes métodos según la situación con la que nos hemos encontrado. Para las campañas de 1962 y 1963, en las que aún no existía cuadrícula de referencia hemos realizado prácticamente una investigación bibliográfica, analizando todos los diarios donde los hallazgos venían descritos. A estos elementos solamente le hemos dado las siglas con el nombre del castro y el año de su descubrimiento, sin poder discriminar ni su cuadrícula ni sus niveles exactos. Evidentemente que esta parte del registro no se pudo reintegrar. En cuanto a las campañas de 1979 a 1986, utilizamos el inventario que ya existía en formato papel y donde ya sí se señalaba la cuadrícula y el nivel de aparición, y además revisamos las cajas de materiales de las que disponíamos para revisar tanto los registros ya introducidos como los nuevos que hiciese falta introducir. Fotografiamos todo este material e hicimos un
recuento de todos los fragmentos y piezas. Hemos reclasificado y reembolsado todo el material de una
manera más adecuada a los tiempos actuales y creado una galería de fotos bastante completa.
En cuanto a la tabla de las UE, la hemos diseñado con 14 campos descriptivos. Antes de introducir los datos,
hemos tenido que reorganizar la estratigrafía. Para reorganizarla nos hemos centrado en la unidad física
mínima identificada en los registros arqueológicos, ya que ésta es el contenedor de los datos con
características analizables, la UE. Hemos establecido 105 UE. Para conseguir determinarlas hemos analizado
todas las cuadrículas de las que poseíamos plano milimetrado y donde aparecían a veces dibujadas las
diferentes manchas que afloraban en los niveles, y que, en ocasiones, se describían al margen. También hemos analizado y redibujado en CAD todos los croquis descriptivos de la estratigrafía de las diferentes
cuadrículas que teníamos, dotando de UE cada nivel, de manera que hemos intentado dar unidades a todos los niveles, manchas, e irregularidades descritas o dibujadas. Además, hemos seguido las anotaciones del
inventario de piezas, en el que se indicaba el nivel donde se habían encontrado, con lo que hemos podido
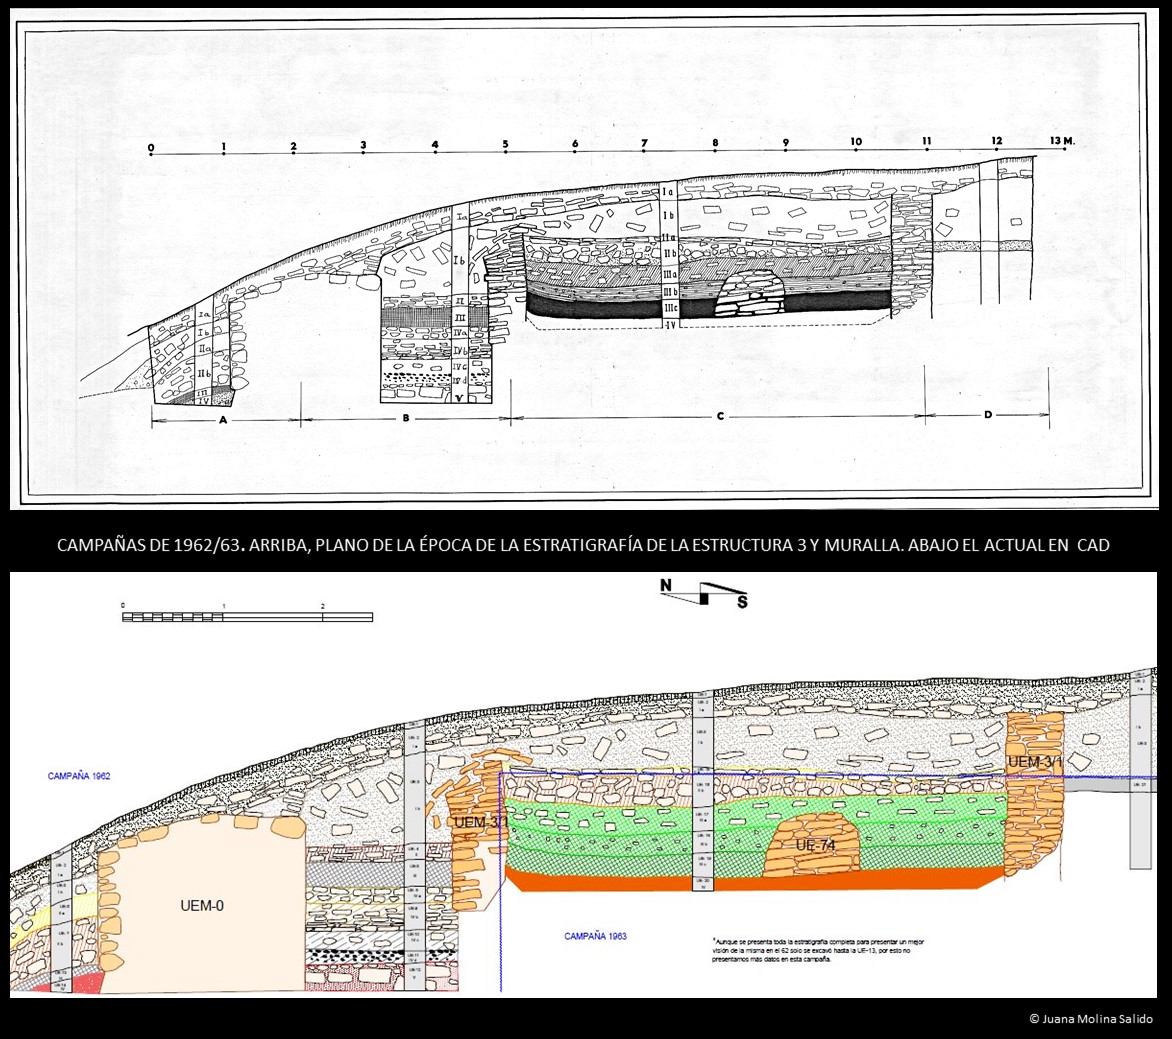
determinar las capas existentes en algunas zonas excavadas pero de las que no había descripción ni croquis (Figura 3 y 4).
En cualquier caso, señalar que ha sido del todo imposible establecer todas las UE de un castro ya excavado.
Junto a esta tabla, hemos desarrollado una tercera, que es la tabla de UEM, donde hemos descrito por medio de 14 campos las estructuras excavadas del castro.
La planimetría del castro
Por otro lado, hemos elaborado como ya hemos señalado al principio de este artículo una completa
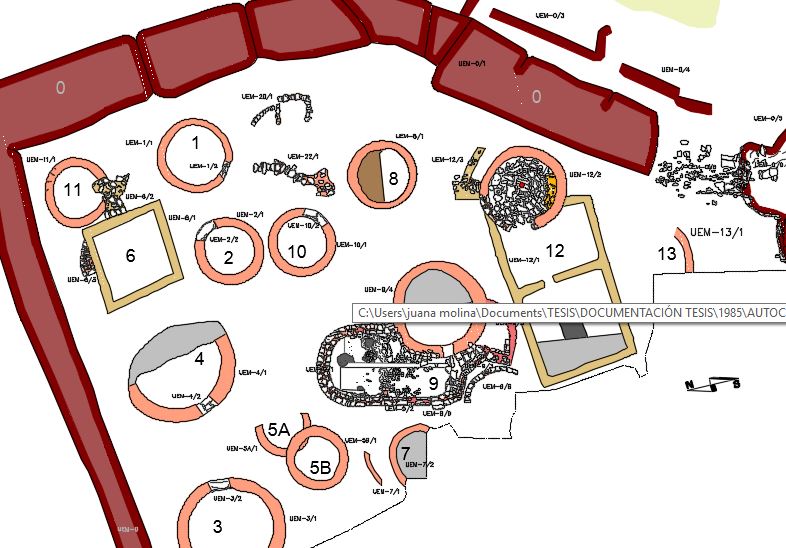
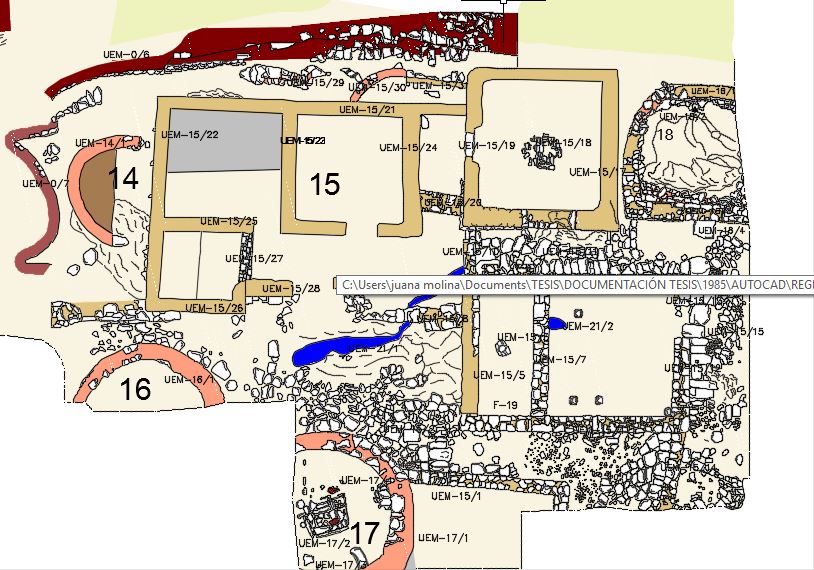
documentación planimétrica del castro de San Chuis. Queríamos no solo reeditar en un nuevo formato (CAD) la información ya existente (planos ya elaborados en formato papel) (Figura 5), sino también crear nueva a partir de nuestros trabajos e investigaciones (por ejemplo la distribución de materiales).
Así, podemos decir que existen tres grupos de planos:
- Los descriptivos de la estratigrafía del castro
- Los descriptivos del propio medio físico del castro, entorno topográfico, geográfico y geológico. En este incluimos también las características urbanísticas del castro.
- Los dedicados al análisis de la distribución de los materiales del castro.
La página web
Una vez que teníamos elaborada toda la IDE del castro era para nosotros del todo necesario hacer llegar toda esta documentación al mayor número de personas posible. El medio era elaborar una página web donde todo lo recapitulado y conocido sobre el castro hasta ahora estuviera disponible.
THE SPATIAL DATA INFRASTRUCTURE (SDI)
One of the objectives we set when we began our research was the construction of the SDI (Spatial Data Infrastructure) of the San Chuis hillfort, with the intention of collecting and structuring all the existing information.
This study represents a «new intervention» on the site, where the information provided by the excavations carried out until 1986 is presented under another approach, recovering the evidence already published previously.
The data infrastructure does not modify the information coming from the excavation, but rather establishes relationships between the data through a standard protocol.
To this end, we have undertaken a general process of digitization and systematization of all the documentation and archaeological information that we managed with the objective of building said SDI. This information, which was mostly on paper, was quite a few years old and was beginning to suffer the logical deterioration of the passage of time. With the construction of the SDI we would not only collect this information in a durable format, but we would proceed to structure and systematize it.
Likewise, we have developed a General Database complemented by a complete descriptive planimetry. At the same time, – and it is one of the most interesting issues in this entire process – we have proceeded to reintegrate the archaeological record in its original spatial context, providing it with real coordinates within a georeferenced information system, which has allowed us to carry out analyzes both macro and micro spatial.
We have, therefore, transformed information presented in an obsolete and heavy format into another that is agile, capable of being treated and analyzed according to more current parameters, also providing new information that we lacked. This procedure can be extrapolated to other ancient sites and its application would facilitate the conservation of information, its research and its dissemination.
It must be taken into account that archaeological heritage has a series of intrinsic characteristics that make it ideal for its integration in information systems of this type: materiality and spatiality.
SDI AND ARCHEOLOGY: A NECESSITY
It must be taken into account that archaeological heritage has a series of intrinsic characteristics that make it ideal for its integration in information systems of this type: materiality and spatiality. archaeological heritage is made up of a whole series of material entities (artifacts, structures, soils, etc.) that are a direct or indirect product of human activity and, in addition, have undergone, after their historical use, a series of processes of deposition and alteration that have changed its own materiality. Archaeological entities therefore have a complex materiality that is susceptible to being systematically analyzed by Archeology to interpret the nature of said processes and the sociocultural context that probably generated them. The analytical description of archaeological entities implies, therefore, the management of a data model that structures and normalizes, as far as possible, the information that we can extract from them (Fraguas et al. 2008).
On the other hand, archaeological entities have a spatial nature that is given to them by the position, shape and dimensions of the discovery context. This can be described by means of a spatial data model.
At the same time, it is very important to highlight that the design of an adequate record of archaeological information is doubly necessary because its very process of obtaining it frequently involves its destruction, particularly during excavation.
The systematized incorporation of information should, therefore, be a priority objective, worthy of a significant research effort. And this is true not only for sites whose excavation is beginning or that are in the middle of the excavation process, but for those that have already been excavated previously and whose information is in perishable and obsolete formats. We believe that every archaeological site is susceptible to being reviewed and that each document and information obtained should be able to be integrated in a readable format and with agreed criteria, thus the information would be accessible and allow continuous validation (Rey Castiñeira et al. 2011). This is our case with the San Chuis hillfort.
The digitization of information from an archaeological intervention involves its integration into a previously developed system, oriented to the use of large amounts of data that enable the acquisition of better knowledge of the historical phenomena under study. The creation of information systems facilitates the introduction of data, but above all, it organizes the way in which it is done, establishing standards in its preparation that allow unifying criteria and establishing control over the quality of the information.
Due to this nature of archaeological data, archaeological information can be defined from the point of view of computer system design as semi-structured. That is, we have a type of heterogeneous information at multiple levels: in the level or degree of structuring, in the models and types of data that we handle, in the representation of said information. For example, we find a huge amount of paper documentation. This type of information, readable by humans but not by machines, is contained in an absolutely perishable medium and must be converted to a machine-readable format. One part may be structured by means of a database. This is the case, for example, of the record, of the different stratigraphic units, etc. Another part of the information will be organized from a Geographic Information System (all information related to positioning and location). But in addition, relationships must subsequently be established between each of the contexts in order to give greater descriptive utility to all this information: relationships must be established between stratigraphic units and material located in them. This is why this material must be georeferenced and integrated into a GIS, which is in turn contained in a relational database, where it is described, etc. This implies that we are going to need different media to be able to structure all our information, and in this case the media are computer applications.
THE SDI OF SAN CHUIS
To develop the SDI we have started from two types of material: that generated in excavations and research, and the photographic album. The first consists of the excavation diaries, the corpus of plans that were prepared at the time and the original record, all in paper format. The second type was made up of Professor Jordá Cerdá’s personal archive, and the subsequent one prepared by ourselves.
The first task we undertook was updating the existing plan made in CAD format, integrating it into a GIS, an essential operation for subsequent procedures. We therefore locate the plan in its UTM coordinates, following the ETRS 89 Geodetic Datum, currently in force in Spain. We had coordinates taken previously but that followed the ED 50 system, so we again took the Information from the SIGPAC Viewer (2016) from the Spanish Agrarian Guarantee Fund (FEGA) of the Ministry of Agriculture, Food and Environment. Likewise, we proceeded to the elaboration of other new plans and a complete descriptive planimetry of the stratigraphy of the fort (CAD format).
At the same time we began the development of a general database in which we included tables to catalog both the archaeological record and the stratigraphic units (SU) and the murary stratigraphic units (MSU). For both the SU and MSU and for the record we proposed fields conveniently descriptive of their nature, but for the latter we also considered the possibility of providing UTM coordinates to each element thereof, that is to say, given that we already had the entire system properly georeferenced, why not try to reintegrate the whole record into its spatial context again and reincorporate it into the system? This would allow us to draw up material distribution plans both by campaigns and by type, proceed to carry out both macro and micro spatial analysis, etc.
Reintegration of the archaeological record
A map that is georeferenced is able to provide the UTM coordinates of any point located on it. Therefore, by integrating our plan into a GIS, we were not only providing coordinates for all the structures that appeared on it, but this plan would also be able to provide the coordinates of any point that we included in it. With this thought we set out to place the representative points of the elements of the record on the plan (Figure 1).
To carry out this task we start from two different types of information: on the one hand, millimeter drawings of the excavated grids with the elements of the record represented in them by means of points, and on the other hand, the X and Y reference measurements of each element found during the excavation, which began to be collected in the 1983 and 1985 campaigns. According to this, we project two ways to insert the points in the plane. If we started from the old plans, the scanning and subsequent insertion of said plans in the general of each campaign. If we started from the X and Y measurements, we simply measured on the plane to place them following the reference grid that had already been made in 1980 (Jordá & Molina, 2015).
Therefore, we proceeded to scan all the plans, creating a documentary base of 112 plans. Of these, we selected those suitable for our purpose, that is, those that represented the 4 m x 4 m grids with the drawn structures and/or the finding points of the different marked materials. We insert these plans into the general plan of the corresponding campaign using the Autodesk Raster Design application, which processes the images allowing us to work with them, and implant them exactly in the place and with the correct scale. We plotted the points and assigned them the same number as they had in the general database record, where each piece is exhaustively described.
Database
The database is composed of three tables: the archaeological record table, the SU table and the MSU table.
As for the record table, it is made up of 20 fields that attempt to exhaustively describe each element that composes it. In total we have included 3326 records. The number of records does not coincide with the number of fragments, which is much greater, since some records correspond to several fragments (Figure 2).
When entering the data into the table we have followed different methods depending on the situation we have found. For the 1962 and 1963 campaigns, in which there was still no reference grid, we have practically carried out bibliographic research, analyzing all the diaries where the findings were described. We have only given these elements the acronym with the name of the hillfort and the year of its discovery, without being able to discriminate either its grid or its exact levels. Obviously this part of the record could not be reintegrated. As for the campaigns from 1979 to 1986, we used the inventory that already existed in paper format and where the grid and the level of appearance were already indicated, and we also reviewed the boxes of materials that we had to review both, the records that were already entered, as well as the new ones that needed to be introduced. We photographed all this material and made a count of all the bits and pieces. We have reclassified and re-bagged all the material in a way more appropriate to current times and created a fairly complete photo gallery.
As for the SU table, we have designed it with 14 descriptive fields. Before entering the data, we had to reorganize the stratigraphy. To reorganize it we have focused on the minimum physical unit identified in the archaeological records, since this is the container of the data with analyzable characteristics, the SU. We have established 105 SU. In order to determine them, we have analyzed all the grids for which we had a millimeter plan and where the different spots that emerged on the levels sometimes appeared drawn, and which were sometimes described in the margin. We have also analyzed and redrawn in CAD all the descriptive sketches of the stratigraphy of the different grids that we had, providing each level with SUs, so that we have tried to give units to all levels, spots, and described or drawn irregularities. In addition, we have followed the annotations of the inventory of pieces, which indicated the level where they had been found, with which we have been able to determine the layers existing in some excavated areas but for which there was no description or sketch (Figures 3 and 4).
In any case, it should be noted that it has been completely impossible to establish all the SUs of an already excavated hillfort.
Along with this table, we have developed a third one, which is the SMUs table, where we have described the excavated structures of the fort through 14 fields.
The planimetry of the hillfort
On the other hand, we have prepared a complete planimetric documentation of the San Chuis fort. We wanted not only to republish in a new format (CAD) the already existing information (plans already prepared in paper format) (Figure 5), but also to create new ones based on our work and research (for example, the distribution of materials).
So, we can say that there are three groups of plans:
- The descriptive ones of the stratigraphy of the hillfort.
- The descriptions of the physical environment of the hillfort itself, topographic, geographical and geological environment. In this we also include the urban characteristics of the hillfort.
- Those dedicated to the analysis of the distribution of the materials of the hillfort.
The website
Once we had prepared all the SDI of the hillfort, it was absolutely necessary for us to get all this documentation to as many people as possible. The means was to create a website where everything recapitulated and known about the hillfort until now was available.
REFERENCIAS |REFERENCES
Fraguas, I. et al.2008. Patrimonio Arqueológico e infraestructuras de Datos Espaciales: la IDE de Casa Montero. V Jornadas Ibéricas de Infraestructuras de Datos Espaciales, JIDEE 2008, http://www.idee.es/resources/presentaciones/JIDEE08/ARTICULOS_JIDEE2008/Articulo67.pdf.
Jordá Pardo, J. F., and Molina Salido, J. 2015. El castro de San Chuis Allande, Asturias, España: ensayo metodológico para la integración y digitalización de la información procedente de antiguas excavaciones arqueológicas, in A. Maximiano Castillejo and E. Cerrillo-Cuenca (eds) Arqueología y Tecnologías de Información Espacial: una perspectiva ibero-americana: 75-87. Oxford: Archaeopress Publishing Ltd.
Molina Salido, J. and Jordá Pardo, J.F. 2016. Algunos apuntes sobre la digitalización y la reconstrucción virtual del castro de san chuis (Allande, Asturias, España). Virtual Archaeology Review 7 15: 98-111. http://dx.doi.org/10.4995/var.2016.5866
Molina Salido, J (2018). From the Archaeological Record to Virtual Reconstruction The Application of Information Technologies at an Iron Age Fortified Settlement (San Chuis Hillfort, Allande, Asturias, Spain), Oxford: Archaeopress Publishing Ltd.
Rey Castiñeira, J. et al. 2011. ‘CastroBYTE’: un modelo para a xestión da información arqueolóxica. Gallaecia 30: 67-106.
Funciona gracias a WordPress
CASTRO DE SAN CHUIS © 2024 by JUANA MOLINA SALIDO is licensed under Creative Commons Attribution-NonCommercial-NoDerivatives 4.0 International
